# Load the ToothGrowth dataset
data("ToothGrowth")

# Inspect the first few rows of the dataset
head(ToothGrowth)
len supp dose
1 4.2 VC 0.5
2 11.5 VC 0.5
3 7.3 VC 0.5
4 5.8 VC 0.5
5 6.4 VC 0.5
6 10.0 VC 0.5Two-Way ANOVA, R Programming, ToothGrowth Dataset, Statistical Modeling, Hypothesis Testing, Interaction Effects, Post-Hoc Analysis
In this blog post, we will perform a Two-Way ANOVA to analyze the effect of two categorical factors on a continuous response variable. We will use the ToothGrowth dataset, which contains information about the effect of Vitamin C on tooth growth in guinea pigs. The two factors are:
supp): Two levels - OJ (Orange Juice) and VC (Vitamin C).dose): Three levels - 0.5, 1, and 2 mg/day.The response variable is tooth length (len).
First, let’s load the ToothGrowth dataset and inspect its structure.
# Load the ToothGrowth dataset
data("ToothGrowth")
# Inspect the first few rows of the dataset
head(ToothGrowth) len supp dose
1 4.2 VC 0.5
2 11.5 VC 0.5
3 7.3 VC 0.5
4 5.8 VC 0.5
5 6.4 VC 0.5
6 10.0 VC 0.5Before performing the Two-Way ANOVA, let’s visualize the data to understand the relationship between the factors and the response variable.
library(ggplot2)

# Boxplot of tooth length by supplement type
ggplot(ToothGrowth, aes(x = supp, y = len, fill = supp)) +
  geom_boxplot() +
  labs(
    title = "Tooth Length by Supplement Type",
    x = "Supplement Type",
    y = "Tooth Length"
  ) +
  theme_minimal()
# Boxplot of tooth length by dose level
ggplot(ToothGrowth, aes(x = factor(dose), y = len, fill = factor(dose))) +
  geom_boxplot() +
  labs(
    title = "Tooth Length by Dose Level",
    x = "Dose Level (mg/day)",
    y = "Tooth Length"
  ) +
  theme_minimal()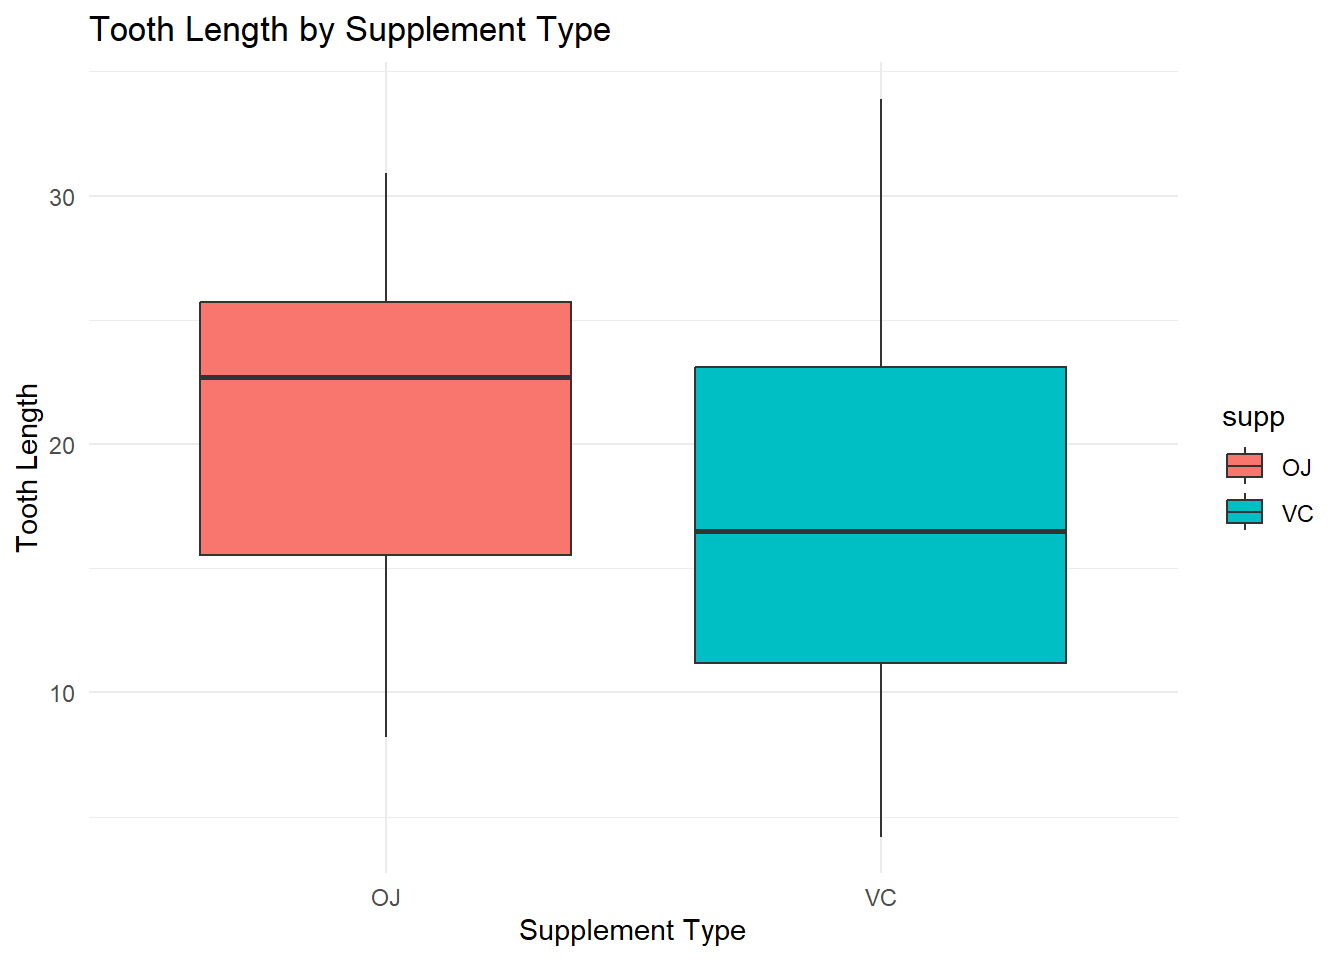

Ensure normality of residuals and homogeneity of variances before trusting ANOVA results. If assumptions are violated, consider a non-parametric alternative.
We will now perform a Two-Way ANOVA to test the following hypotheses: 1. Main effect of supplement type (supp): Does the type of supplement affect tooth growth? 2. Main effect of dose level (dose): Does the dose level affect tooth growth? 3. Interaction effect (supp:dose): Is there an interaction between supplement type and dose level?
# Perform Two-Way ANOVA
anova_result <- aov(len ~ supp * factor(dose), data = ToothGrowth)

# Display the ANOVA table
anova(anova_result)
Analysis of Variance Table
Response: len
Df Sum Sq Mean Sq F value Pr(>F)
supp 1 205.35 205.35 15.572 0.0002312 ***
factor(dose) 2 2426.43 1213.22 92.000 < 2.2e-16 ***
supp:factor(dose) 2 108.32 54.16 4.107 0.0218603 *
Residuals 54 712.11 13.19
---
Signif. codes: 0 '***' 0.001 '**' 0.01 '*' 0.05 '.' 0.1 ' ' 1supp): The p-value is highly significant (p < 0.001), indicating that the type of supplement (supp) has a significant effect on tooth length. In other words, there is a statistically significant difference in tooth growth between the two supplement types (OJ and VC).dose): The p-value is extremely significant (p < 0.001), indicating that the dose level (dose) has a highly significant effect on tooth length. This means that the amount of supplement administered (0.5, 1, or 2 mg/day) significantly influences tooth growth.supp:dose): The p-value is significant (p < 0.05), indicating that there is a statistically significant interaction between supplement type and dose level. This means that the effect of supplement type on tooth growth depends on the dose level, or vice versa. In other words, the combination of supplement type and dose level has a unique effect on tooth length that cannot be explained by the individual effects of supp and dose alone.Always examine whether the interaction between factors (`supp * dose`) is significant before interpreting the main effects separately. If interaction is present, effects of one factor depend on the other.
Both supplement type (supp) and dose level (dose) have significant main effects on tooth length.
There is also a significant interaction effect between supplement type and dose level, meaning the effect of one factor depends on the level of the other factor.
These results suggest that both the type of supplement and the amount administered are important factors in tooth growth, and their combined effect should be considered when interpreting the data.
If the ANOVA results indicate significant effects, we can perform post-hoc tests to identify which specific groups differ. For example, we can use Tukey’s HSD test for pairwise comparisons.
# Perform Tukey's HSD test
tukey_result <- TukeyHSD(anova_result)

# Display the results
tukey_result
Tukey multiple comparisons of means
95% family-wise confidence level
Fit: aov(formula = len ~ supp * factor(dose), data = ToothGrowth)
$supp
diff lwr upr p adj
VC-OJ -3.7 -5.579828 -1.820172 0.0002312
$`factor(dose)`
diff lwr upr p adj
1-0.5 9.130 6.362488 11.897512 0.0e+00
2-0.5 15.495 12.727488 18.262512 0.0e+00
2-1 6.365 3.597488 9.132512 2.7e-06
$`supp:factor(dose)`
diff lwr upr p adj
VC:0.5-OJ:0.5 -5.25 -10.048124 -0.4518762 0.0242521
OJ:1-OJ:0.5 9.47 4.671876 14.2681238 0.0000046
VC:1-OJ:0.5 3.54 -1.258124 8.3381238 0.2640208
OJ:2-OJ:0.5 12.83 8.031876 17.6281238 0.0000000
VC:2-OJ:0.5 12.91 8.111876 17.7081238 0.0000000
OJ:1-VC:0.5 14.72 9.921876 19.5181238 0.0000000
VC:1-VC:0.5 8.79 3.991876 13.5881238 0.0000210
OJ:2-VC:0.5 18.08 13.281876 22.8781238 0.0000000
VC:2-VC:0.5 18.16 13.361876 22.9581238 0.0000000
VC:1-OJ:1 -5.93 -10.728124 -1.1318762 0.0073930
OJ:2-OJ:1 3.36 -1.438124 8.1581238 0.3187361
VC:2-OJ:1 3.44 -1.358124 8.2381238 0.2936430
OJ:2-VC:1 9.29 4.491876 14.0881238 0.0000069
VC:2-VC:1 9.37 4.571876 14.1681238 0.0000058
VC:2-OJ:2 0.08 -4.718124 4.8781238 1.0000000The Tukey post hoc test results provide multiple pairwise comparisons to determine significant differences between groups. Below is an interpretation of each section:
supp)VC vs. OJ: The mean difference is -3.7, meaning that the OJ supplement leads to significantly greater tooth growth than VC.
Confidence Interval: (-5.58, -1.82) does not include zero, indicating a statistically significant difference.
p-value: 0.0002312 (< 0.05), confirming the significance of the difference.
dose)1 vs. 0.5: A significant increase in tooth growth is observed (Mean difference = 9.13, p < 0.0001).
2 vs. 0.5: A further increase in tooth growth is seen (Mean difference = 15.495, p < 0.0001).
2 vs. 1: There is also a significant difference between dose 1 and 2 (Mean difference = 6.365, p < 0.0001).
Overall: Increasing dose levels significantly improve tooth growth.
supp:dose)VC:0.5 vs. OJ:0.5: The mean difference is -5.25 (p = 0.024), indicating that OJ leads to more growth at the 0.5 dose.
OJ:1 vs. OJ:0.5: A significant increase in growth (Mean difference = 9.47, p < 0.0001).
OJ:2 vs. OJ:0.5 & VC:2 vs. OJ:0.5: Both show significant increases in growth.
VC:2 vs. OJ:2: No significant difference (p = 1.000), suggesting similar effects at the highest dose level.
If the confidence interval of a comparison includes zero, the difference may not be meaningful. Always look at both the confidence intervals and p-values together.
A compact letter display (CLD) plot or a Tukey HSD plot is appropriate for academic research. These plots help visualize significant differences while maintaining clarity.
Why this Visualization?
Clearly shows pairwise comparisons.
Highlights confidence intervals, aiding interpretation.
Uses coord_flip() to make comparisons readable in a horizontal layout.
# Convert Tukey results to a data frame
tukey_df <- as.data.frame(tukey_result$`supp:factor(dose)`)
tukey_df$Comparison <- rownames(tukey_df)

# Plot
ggplot(tukey_df, aes(x = reorder(Comparison, diff), y = diff)) +
  geom_point(size = 3) +
  geom_errorbar(aes(ymin = lwr, ymax = upr), width = 0.2) +
  coord_flip() +
  labs(
    title = "Tukey HSD Post Hoc Test Results",
    x = "Group Comparisons",
    y = "Mean Difference in Tooth Growth",
    caption = "Error bars indicate 95% confidence intervals"
  ) +
  theme_minimal(base_size = 14)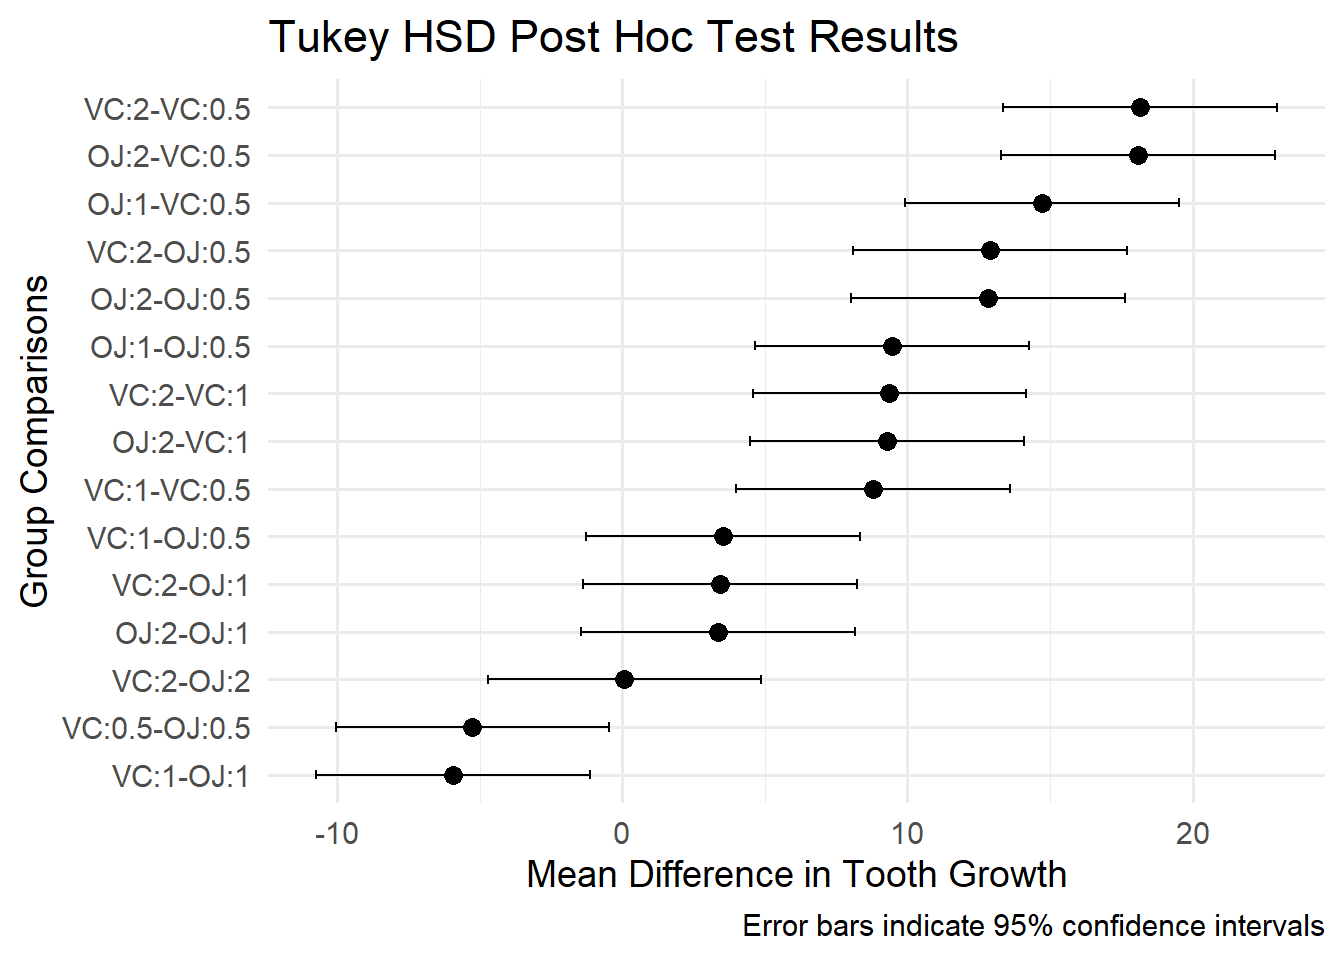
The study demonstrates that both supplement type and dosage significantly influence tooth growth. OJ is generally more effective than VC, especially at lower doses. However, at the highest dose (2.0), both supplements yield similar results, suggesting a potential saturation effect. These findings provide insights into optimizing supplement and dosage choices for promoting dental health.